Threat Spotlight: Cisco Talos Thwarts Access to Massive International Exploit Kit Generating $60M Annually From Ransomware Alone
October 6, 2015
Executive Summary
Today, Cisco struck a blow to a group of hackers, disrupting a significant international revenue stream generated by the notorious Angler Exploit Kit. Angler is one of the largest exploit kit found on the market and has been making news as it has been linked to several high profile malvertising/ransomware campaigns. This is the most advanced and concerning exploit kit on the market – designed to bypass security devices and ultimately attack the largest number of devices possible.
In its research, Cisco determined that an inordinate number of proxy servers used by Angler were located on servers of service provider Limestone Networks with the primary threat actor responsible for up to 50 percent of Angler Exploit Kit activity, targeting up to 90,000 victims a day, and generating more than $30M annually. This implies that if you apply the full scope of Angler activity the revenue generated could exceed $60M annually. Talos gained additional visibility into the global activity of the network through their ongoing collaboration with Level 3 Threat Research Labs. Finally, thanks to our continued collaboration with OpenDNS we were able to gain in depth visibility into the domain activity associated with the adversaries.
Cisco then took action:
- Shutting down access for customers by updating products to stop redirects to the Angler proxy servers
- Released Snort rules to detect and block checks from the health checks
- All rules are being released to the community through Snort
- Publishing communications mechanisms including protocols so others can protect themselves and customers
- Cisco is also publishing IoCs so that defenders can analyze their own network activity and block access to remaining servers
- Contacted affected hosting providers to shut down malicious servers
This is a significant blow to the emerging hacker economy where ransomware and the black market sale of stolen IP, credit card info and personally identifiable information (PII) are generating hundreds of millions of dollars annually.
Technical Overview
It seems like every week Angler Exploit Kit is in the news, whether it's Domain Shadowing, zero-day integration, or large scale malvertising campaigns, it consistently dominates the threat landscape. It's a constant fight between the adversaries and the defenders. We are constantly monitoring and updating coverage for the threat. Based on this constant battle, Talos decided to dive deep on Angler's telemetry data and has made some astounding discoveries.
The dataset was originally from July 2015 and included data from all sources available. July provided a unique opportunity because Angler went through several iterations of development, including URL structure changes and implementation of several unpatched Adobe Flash vulnerabilities. During the analysis, trends and patterns emerged. This paper will discuss trends in hosting, domain usage, referers, exploits, and payloads. It was the trends associated with the hosting that lead to the most significant discoveries.
While analyzing the data we found that a large amount of Angler activity was focused with a single hosting provider, Limestone Networks. Talos collaborated with Limestone to gather some previously unknown insight into Angler. This includes details related to data flow, management, and scale.
Angler is actually constructed in a proxy/server configuration. There is a single exploit server that is responsible for serving the malicious activity through multiple proxy servers. The proxy server is the system that users communicate with, allowing the adversary to quickly pivot and change while still shielding the exploit server from identification and exposure. Additionally, there is a health monitoring server that is conducting health checks, gathering information about the hosts that are being served exploits, and remotely erase the log files once they have been fetched. This health server revealed the scope and scale of the campaign, and helped allow us to put a monetary value on the activity.
A single health server was seen monitoring 147 proxy servers over the span of a month and generating in excess of $3,000,000 USD in revenue. This single adversary was responsible for approximately half of the Angler activity we observed and is making more than $30,000,000 USD annually from Ransomware infections alone.
The monetization of the malware economy has continued to evolve over the last several years. Every single year we see small innovations that lead towards the occasional major advance. Today we’re seeing the results of years of major advances being combined with a drive by download vector to form one of the most effective and profitable attacks facing the internet.
Introduction
Angler is an exploitation machine, continuing to compromise users at a high rate for a long time. This is due largely to how effective and innovative Angler has been. Whether it is Domain Shadowing, 302 Cushioning, Encrypted Payloads, or rapid exploit deployment, Angler has dominated 2015, as predicted in last years Annual Security Report. While conducting this research Talos was able to obtain information about hosts serving Angler. We now have a good approximation around Angler’s revenue stream. By analyzing the behavior of just one node delivering Angler as well as a server monitoring these systems, Talos can reliably say that one threat actor was responsible for up to half of the Angler activity that we’ve observed globally. This malicious network generates approximately more than $30 million annually, which we will cover in detail later.
Angler is a major threat on the landscape today and this illustrates how much money there is to be made by these nefarious activities. July 2015 provided an interesting opportunity for some data analytics for Angler. The exploit kit itself evolved its URL structure multiple times and several unpatched vulnerabilities in Adobe Flash were added to the exploit kit during the month. Talos had a unique opportunity with a large, robust dataset to really look at how Angler trended and evolved over the month. This gave us an opportunity to look at a lot of different aspects of Angler and show the reasons it has been so successful at compromising users.
The culmination of this analysis lead us to uncover previously undisclosed aspects of Angler, including information about how Angler operates and the amount of users affected. This was largely made possible through collaboration with Limestone Networks, Level 3, and analysis of our own infield telemetry. Limestone Networks hosting environment was responsible for a large percentage of Angler activity. Now, with the help of Talos, they are currently no longer being used as hosting provider by Angler customers and we were able to develop the coverage necessary to block the backend communication dealing a significant blow to Angler's ability to compromise users.
The Data
Talos has gathered a huge amount of data surrounding Angler for the month of July. This includes live detonation as well as telemetry from thousands of affected users. This data has been analyzed to highlight some interesting details including: IP address use, hosting information, exploit breakdown, hash data, payload information, referers, redirection chains, and the impact new exploits had on Angler.
Overview
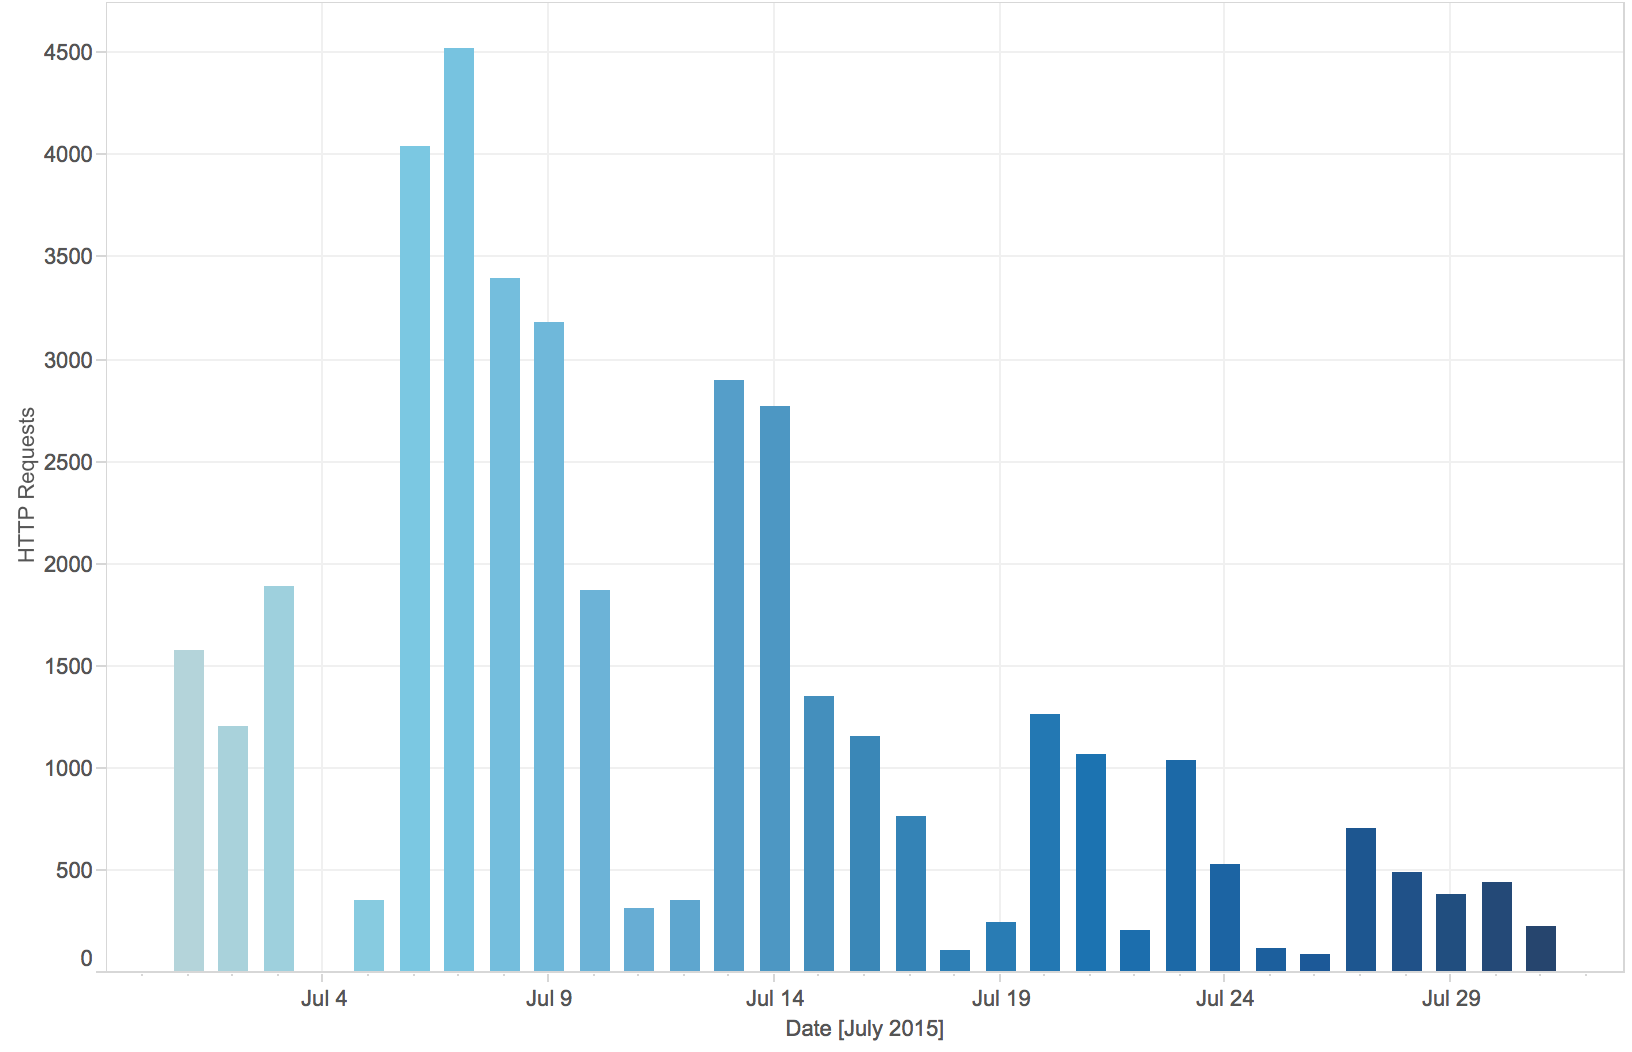
Let's start with an overview of what we found through the course of the month. Below is an image showing Angler activity throughout the month, based on our telemetry data. As expected the largest peaks are associated with the “Hacking Team” zero-days (CVE-2015-5119, CVE-2015-5122) being added to the Angler exploit arsenal. One interesting aspect was that the scale of infrastructure actually hosting Angler did not increase during this period. This was one of the first or many unexpected things that Talos discovered.
Infrastructure Analysis
IP Infrastructure
The raw amount of IP addresses did not fluctuate much from one day to the next and stayed relatively stable. Below is a graph showing the amount of unique IP addresses that Talos observed throughout the month.
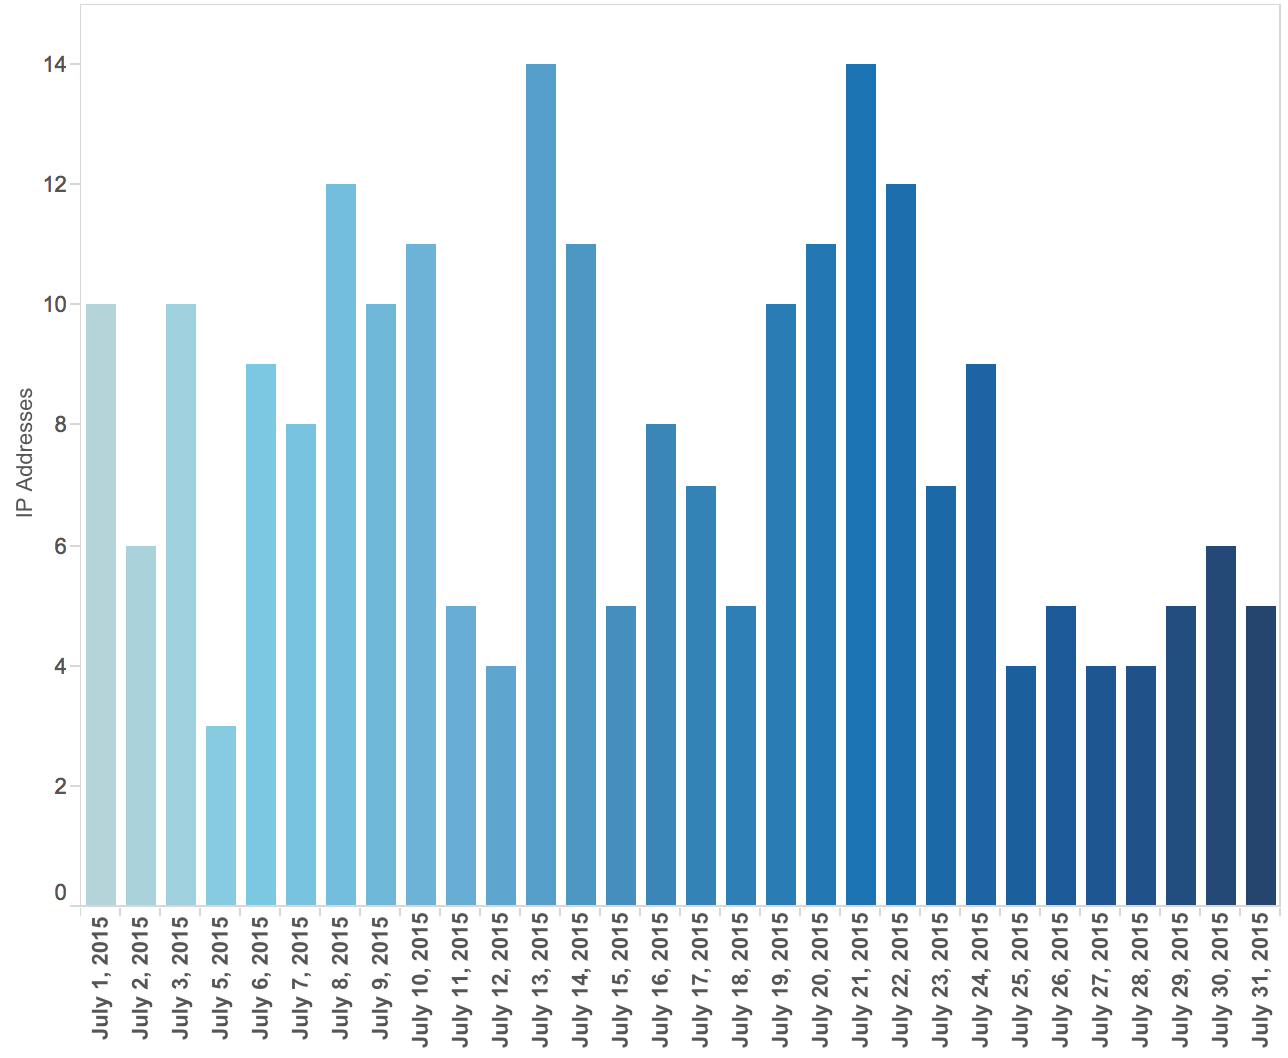
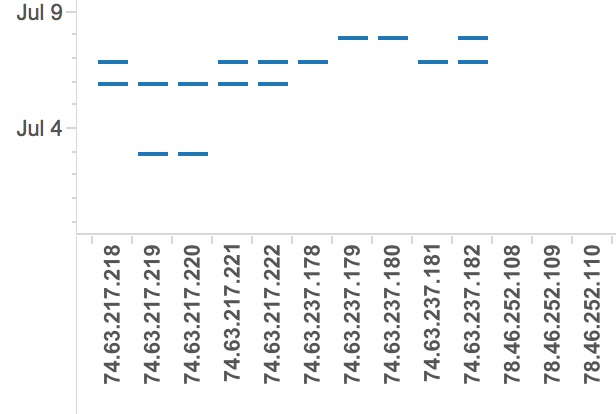
This is a consistent trend for Angler. It's one of the most innovative exploit kits available today, but it doesn't have a large footprint from an infrastructure perspective. Despite not having a large footprint, Angler is able to compromise a significant amount of users, for a presumably small amount of customers. An interesting aspect is the lack of IP variety from day to day. Angler starts with an IP address (i.e. 74.63.217.218) as the system compromises users and generates noise the adversaries shift to an adjacent IP (i.e. 74.63.217.219). This activity would continue through contiguous blocks of IP space being used from a single provider. Indicating that the actors likely had multiple servers available moving from one server to the next as they were blocked. Below is a graphic depicting one such occurrence, showing the shift in IP space over time.
ASN Info / Hosters
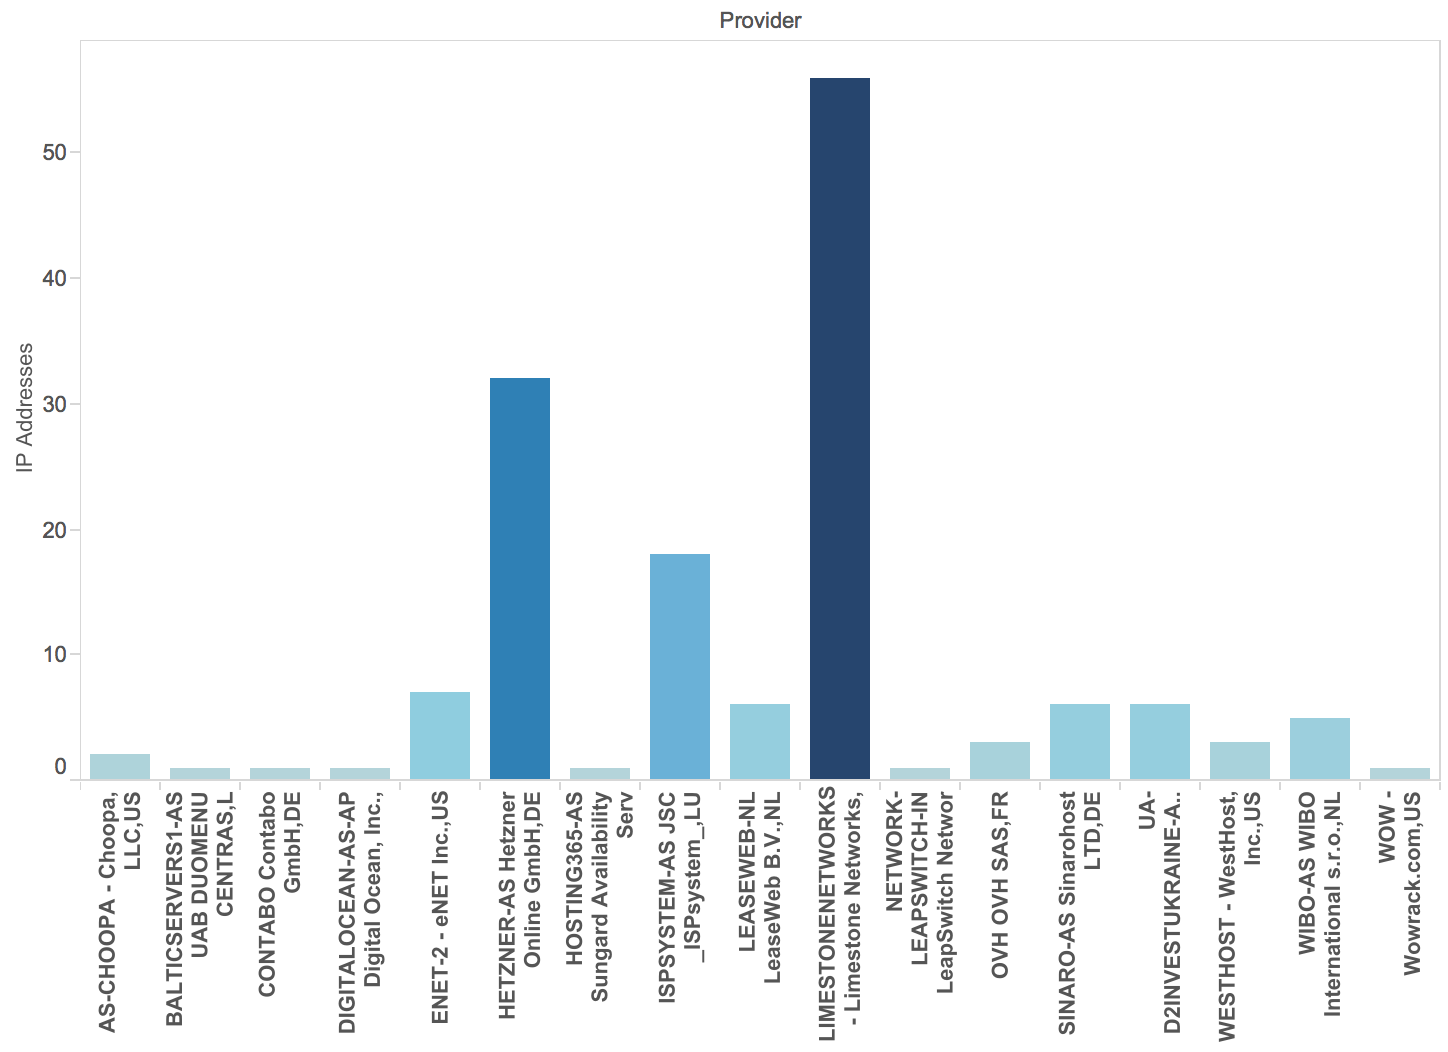
Expanding further on the IP infrastructure, Talos dove into the ASNs and hosting providers that were serving Angler exploit kit. Talos began by looking at the volume of traffic based on the provider associated with the IP space. Below is a graph showing the results:
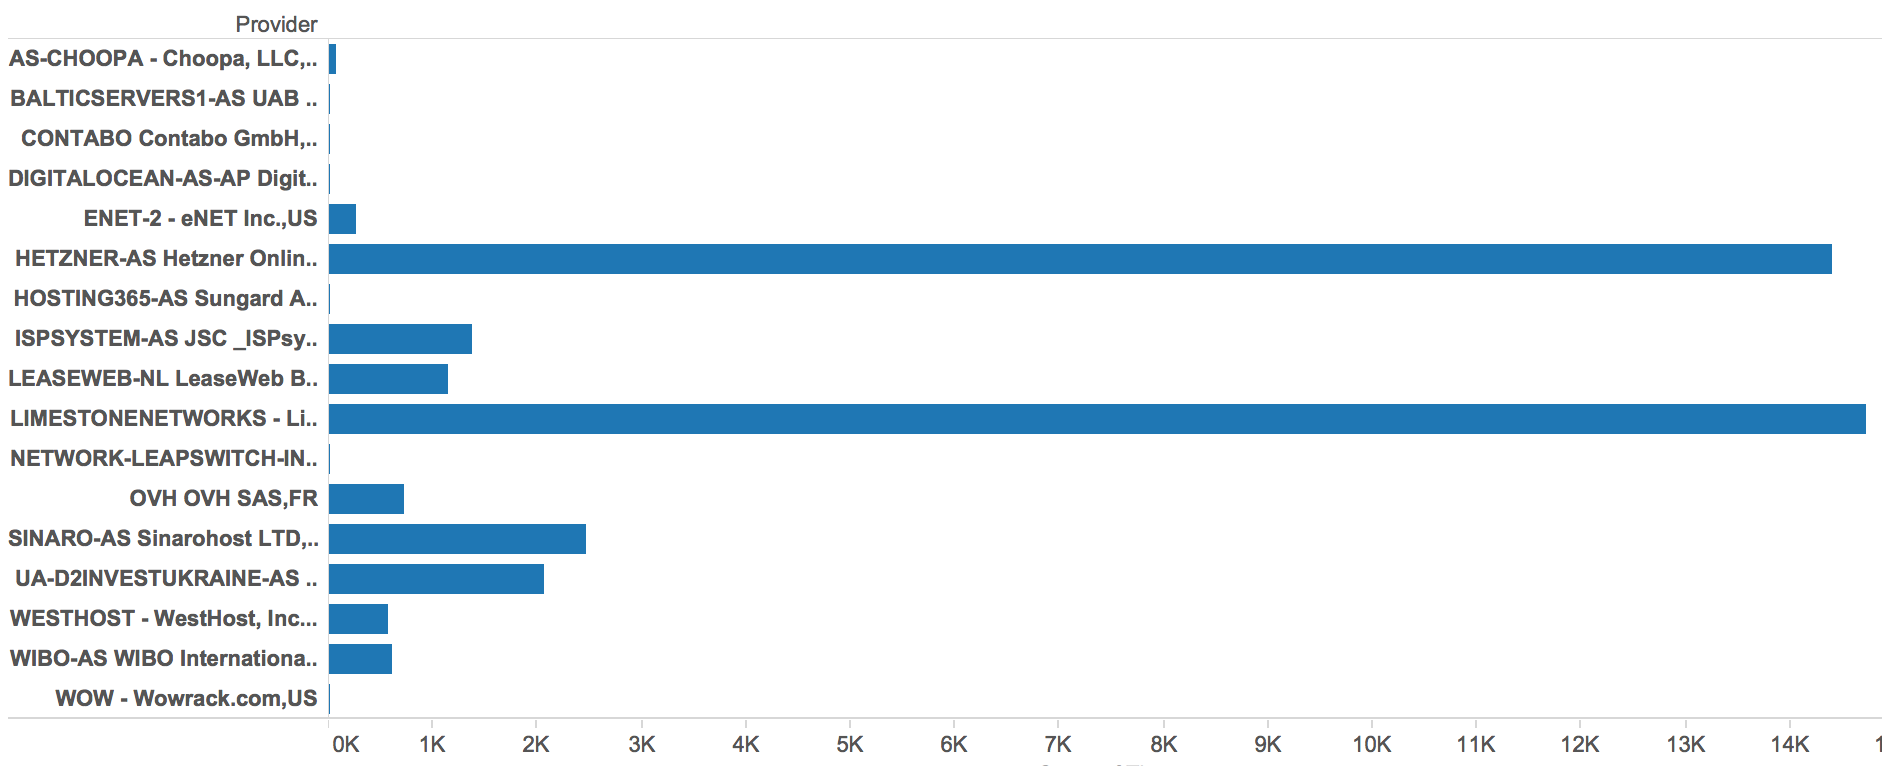
There were a total of 17 unique ASNs observed over the month. Two of those, Hetzner and Limestone Networks, accounted for almost 75% of the overall volume of traffic for the month. Initially it appeared that these two providers were responsible for the majority of Angler infections. However, when that data was plotted against the amount of unique IP addresses a different story was told.
Looking at the amount of unique IP's, while it is still clear that Hetzner and Limestone Networks were the primary sources of Angler, Limestone Networks was the largest single provider. During the month of July more than a third of the IP's delivering Angler were hosted by Limestone Networks. This trend continued throughout the month of August, however, in lower volume.Today, with our help this activity has stopped within Limestone.
Talos approached both Hetzner and Limestone related to the information we gathered on these threat actors. Limestone Networks responded and cooperated fully with this investigation. With their help we were able to learn about the behaviour used by these actors as they are setting up infrastructure.
For example an account would purchase 815 servers during the course of a week using stolen credit cards originating from different countries. This would continue gradually allowing the users to accumulate a fair amount of server infrastructure. Eventually the credit cards would be identified as stolen and significant costs are incurred. According to Limestone Networks our adversaries “contributed approximately $10,000 in cost and lost revenue each month.” The vast majority of this in charge backs due to fraudulent credit card charges.
With the help of Talos, Angler has stopped using them as a source of malicious activity, both saving Limestone money and eliminating one more conduit for Angler to exploit. Limestone Networks was also able to provide us with copies of images of the servers that were being used as well as network captures of the communications the servers were conducting for short time periods. As a result of this Talos was able to get valuable information that exposed previously undisclosed aspects of Angler, as well as the scope of the users impacted. We also were able to work with Level3 to gather additional visibility through Netflow. The details of the findings are addressed later in this post.
Exploit Kit Analysis
Referers
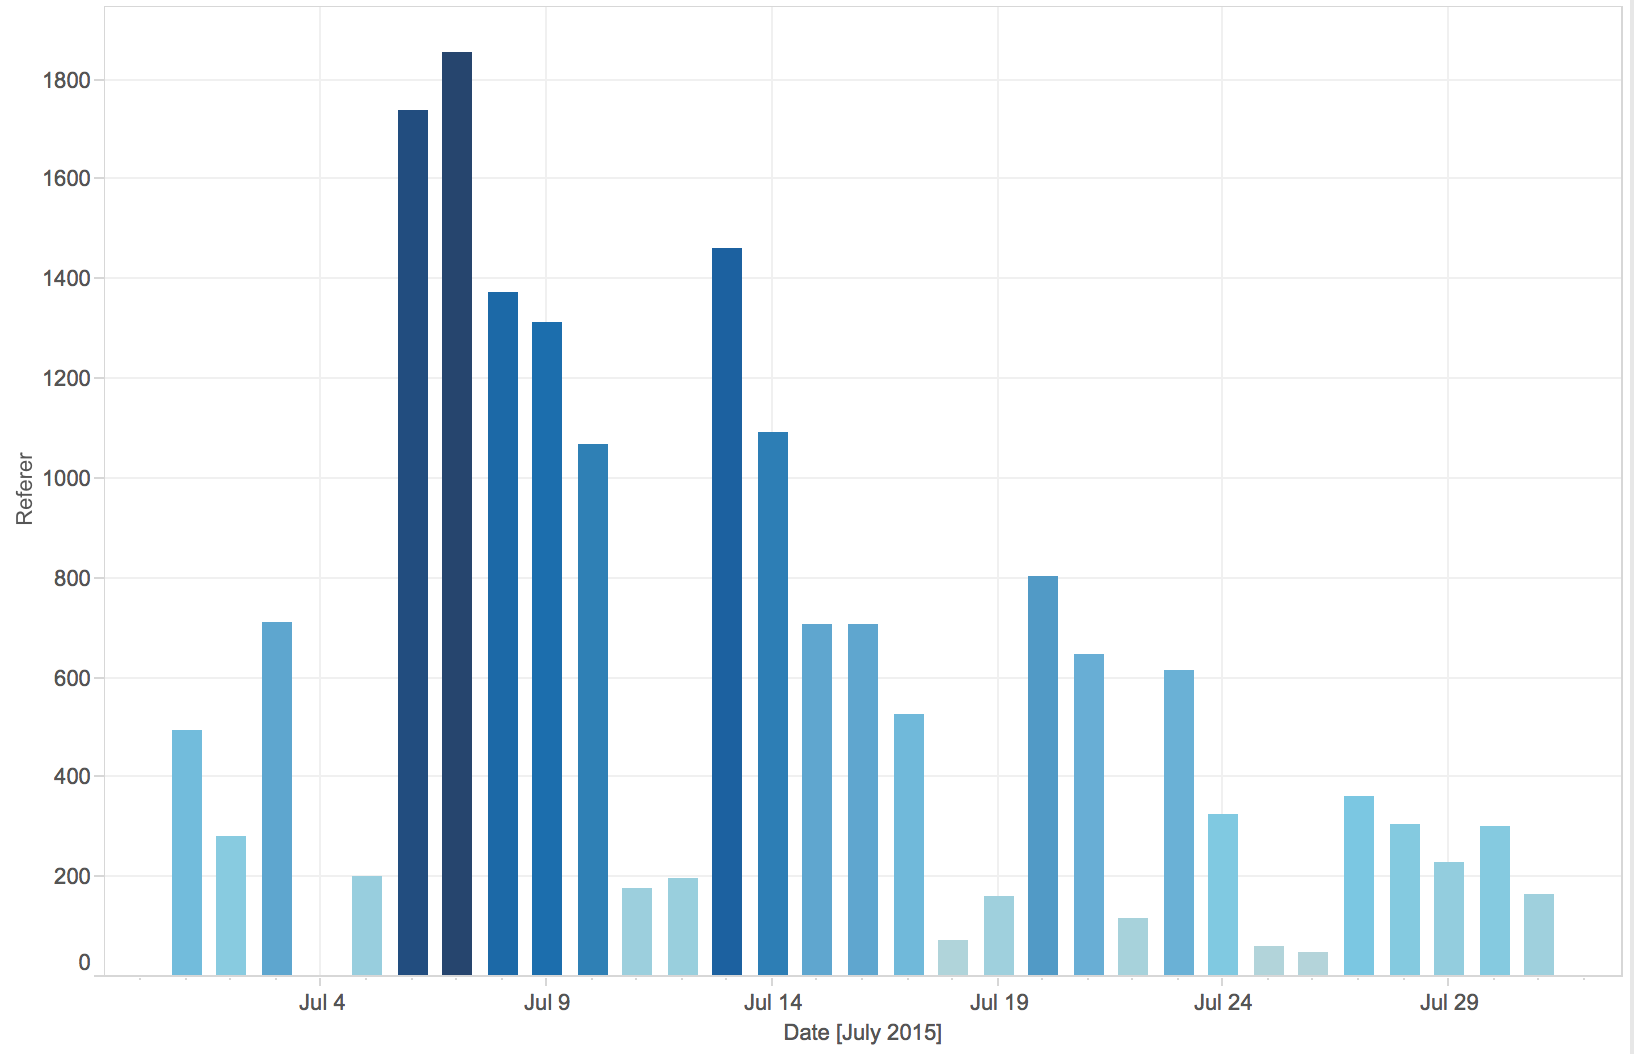
Users do not just browse to an exploit kit they are pushed into it there via malicious iFrames and malvertising. Both were found in significant volume during the course of the month. Talos observed popular websites redirecting users to the Angler exploit kit via malvertising including hundreds of major news, real estate, and popular culture sites. Additionally, we found countless examples of small seemingly random websites doing the same type of redirection including a single person's obituary from a small newspaper in rural United States. The most interesting aspect was the volume of unique referers and the frequency with which they were used. We were able to find more than 15,000 unique sites pushing people into the exploit kit, 99.8% percent of which were used less than ten times, illustrating the low frequency. That means that the majority of referers were only active for a short period of time and were removed after a handful of users were targeted. This is one of the features that makes Angler so difficult to hunt. The following graph shows the unique referers Talos observed during the month of July. Throughout our analysis we noted that the peaks in activity coincided with the various “Hacking Team” zero-day (CVE-2015-5119, CVE-2015-5122 ) exploits.
Dynamic DNS Redirection
Additionally, Talos noticed a couple of smaller volume referer chains that were being used, either as a way to directly get users to Angler or just add a layer to the redirection chain. The first was the use of dynamic DNS services. We first reported this in a blog from earlier this year but it had largely disappeared. During this research Talos found the dynamic DNS provider had changed but the behavior was the same. URLs similar to the following keep popping up in the data:
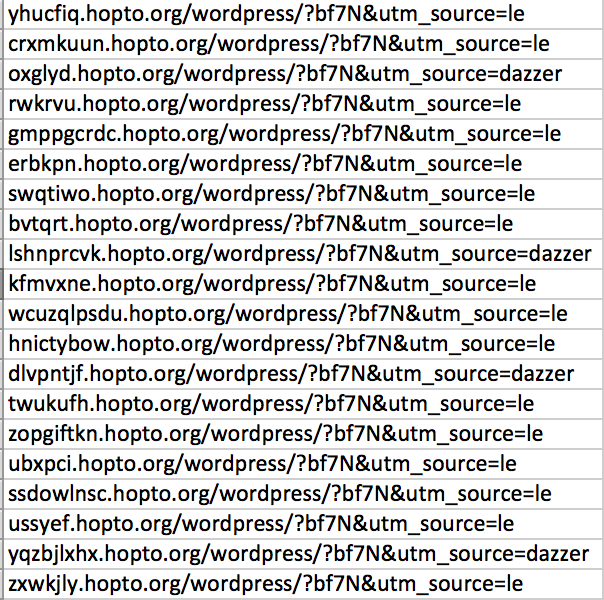
During the month the only DDNS provider used was hopto.org. Talos has previously seen several other providers being used but the syntax was largely the same /wordpress/?bf7N&utm_source=XXXX. This is the same pattern that had been observed several months ago. If you attempt to browse to these web pages you are greeted with a empty NGINX style web hosting parking page. When we pivoted on this data and found the true origin of the attack as they were all being redirected from compromised wordpress sites. These dynamic DNS based web pages were being used as an added level of complexity to the redirection method Angler was using. The end result of this redirection scenario was to ultimately bring the user to the malicious landing page. However, this extra tier was required for the users to be served a landing page, which is common for Angler. This ensures that only the users that are following the infection path will be affected and those trying to run down the exploit kit payload will be unsuccessful by browsing directly to the landing page.
Shadowed Redirection
A similar type of service has also been observed gaining volume recently. It also made use of an additional tier of redirection using shadowed domains. These were almost exclusively javascript files that are hosted under englishword based sub folders similar to the following:
It was responsible for a small portion of the Angler infections and again was just another tier being redirected through both compromised wordpress sites and malvertising.
URL Evolution
One reason that Talos decided to take a deeper dive on the data for Angler in July was the metamorphosis it went through related to URL structure. The structural changes focused on the landing page but there were also subtle changes in the exploit page. At the beginning of the month the typical Angler landing page URL looked similar to the following:
The basic syntax is to use 'search' with a series of parameters attached as query parameters. This structure had been used for weeks, but on July 3rd the changes began. First was a shift to <random_word>.php URLs. That produced a landing page URL structure similar to the following:
However, the basic parameter structure remained the same as the previous version. This activity lasted until July 8th when another drastic change occurred. Beginning on the 8th Angler focused on hiding in the noise instead of making drastic changes to avoid detection. It started with the use of viewtopic.php with a couple of basic parameters similar to the following:
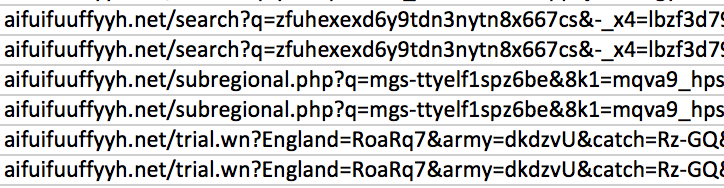
This type of URL is common on the internet and creates a challenge when trying to differentiate and is still being used today. However, on the July 15th Angler added a couple more URLs, viewforum.php & search.php, examples of which can be found below:
clivoso<dot>klinefilms<dot>com/evicts/search.php?keywords=616&fid[0]=2745796
Also of note is the use of subdirectories here. Finally, as of August 5th, Angler has added one more file, index.php. All of the current URL syntax for landing pages look like normal web traffic and that is no accident. It is much easier to trick users and detection technologies by making the URLs look like legitimate, common web traffic. The Angler exploit kit continues to shine with this methodology.
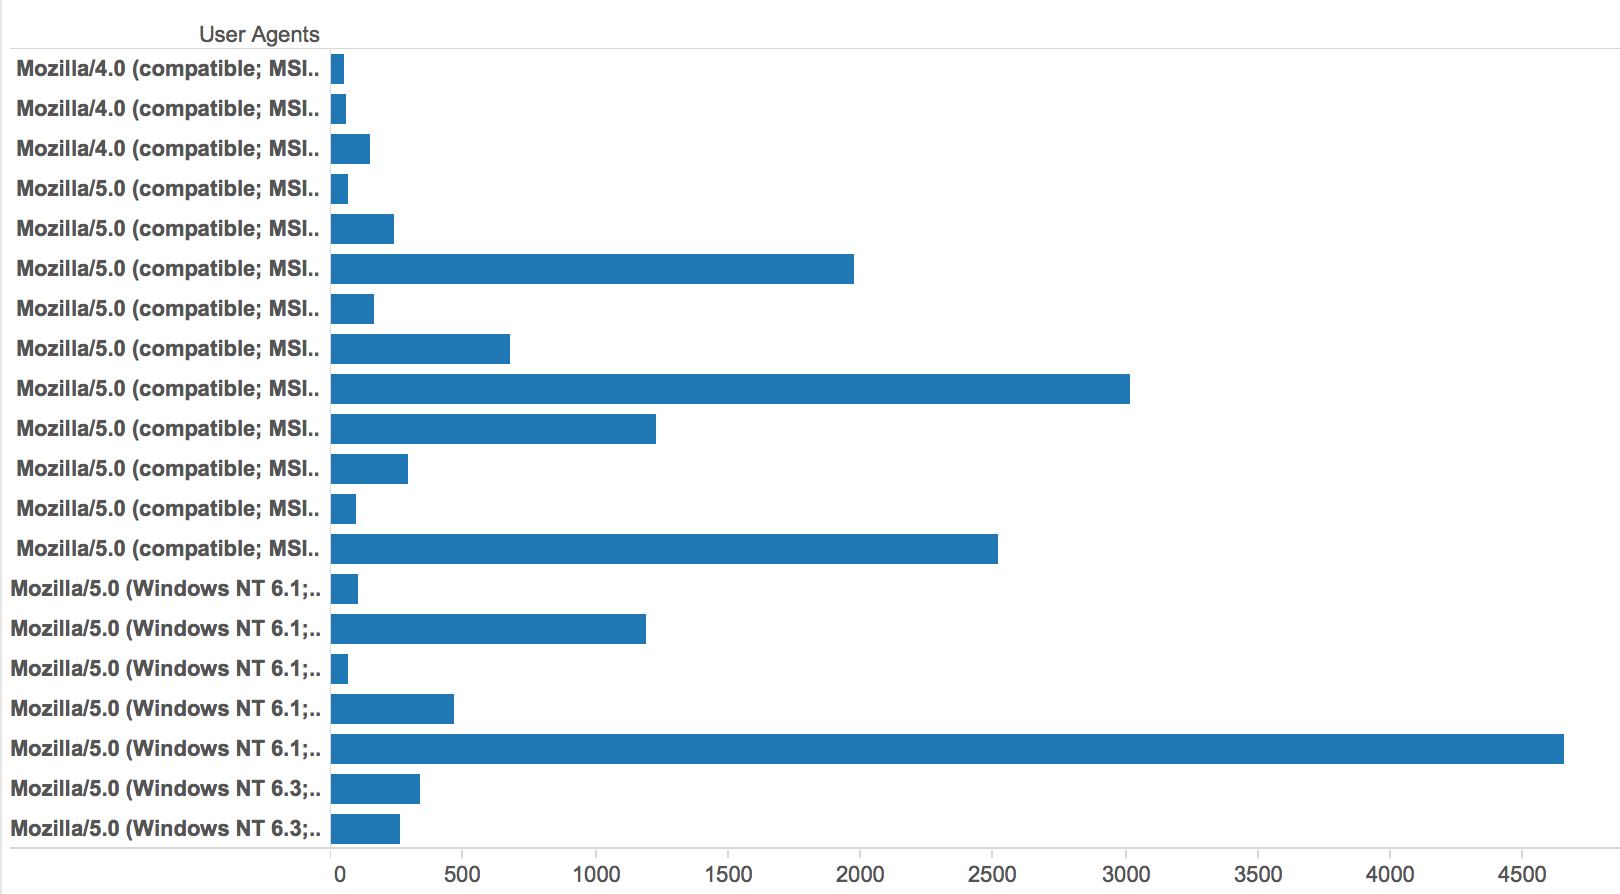
Due to the large dataset that Talos had to work with we were able to do an analysis of the most common web browsers that were impacted. A huge variety of different browsers and operating systems hit Angler landing pages (including Netscape 4.0 which was a bit surprising, but not all of those users were served exploits). Overwhelmingly the most common browsers to be served actual exploits were Internet Explorer and the reasons we believe are two fold. First is that Angler leveraged CVE-2014-6332 heavily for the last six months and continues to do so (Angler also recently added CVE-2015-2419 also targeting IE), this exploit is targeted specifically at Internet Explorer users. The second is that the other major web browsers, Chrome and Firefox, have gone to great lengths to either sandbox Adobe Flash or prevent any flash rendering with outdated versions. Firefox even went so far as to block all Flash activity when the Hacking Team zero-days (CVE-2015-5119, CVE-2015-5122) were disclosed to prevent its users from being impacted.
Going back to CVE-2014-6332 Talos noticed that when this particular exploit was served, for some reason, there was no User Agent string provided. All other exploit pages had user agents, the ones being served CVE-2014-6332 did not, a sample of which is shown below.
Exploit Details
Not surprisingly the overwhelming majority of the exploits Angler was serving were tied to Adobe Flash. Almost 75% of the exploits served to users were Adobe Flash related. This was an expected outcome with two Adobe Flash zero-days (CVE-2015-5119, CVE-2015-5122) being leveraged by Angler during the month. The two remaining exploit groups were somewhat surprising. The second largest group was related to the Internet Explorer vulnerability CVE-2014-6332 , which accounted for a little more than 20% of the infections. The final group was the most surprising with approximately 2% of users being served Silverlight vulnerabilities. This indicates that the three classes of exploit being leveraged by Angler were Flash, IE, and Silverlight. The one shocking omission from that group was Java. Historically Angler, and most exploit kits, have continued to exploit Java, largely because there is still a significant pool of users running older, vulnerable versions of Java.

One of the biggest reasons that Angler has been so pervasive and able to infect as many users is the lack of antivirus coverage. During the month of July Talos observed almost 3,000 unique hashes associated with exploits. That data was then queried against VirusTotal which found that only 6% of the hashes were in VirusTotal. Of that 6% the average detection was low, with usually less than ten AV engines detecting it. This, coupled with the recent large scale malvertising campaign, reinforces that a user browsing the internet using Internet Explorer with only basic antivirus protection is highly vulnerable to an Angler infection.
Payloads
Angler's payloads have been discussed extensively. Talos data didn't reveal any significant variances in that data with the more than 60% of the infections delivering a ransomware variant. Talos has observed both Cryptowall 3.0 as well as Teslacrypt 2.0 being delivered by Angler during this time period. Both ransomware variants leverage compromised wordpress sites to push data for later retrieval.
The other significant payloads were largely the Bedep downloader which relies on DGA based C2 infrastructure to deliver additional payloads. Talos commonly observed click fraud being delivered, but also found several instances of keyloggers and various types of Trojans being delivered as well. One interesting note is that the two largest providers hosting Angler delivered a ransomware variant exclusively. Talos was unable to find a different payload being delivered in the telemetry that was observed.
Other Patterns
There are some other interesting patterns that started to emerge when analyzing a dataset of this size. First was related to the way the Angler leveraged domains to host their malicious activity. Talos discovered and has discussed Domain Shadowing at length. This continues to be the dominant technique used to host Angler, but there were other outliers found. Talos has still found Angler being hosted using static IP addresses, however this accounted for a very small fraction of the overall activity.
Talos was also able to find Angler instances that were being hosted by actor owned domains, without the use of subdomains. This again accounted for a small part of the overall Angler telemetry.
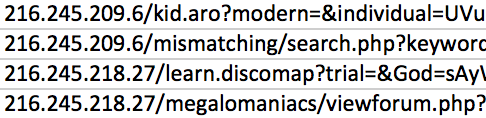
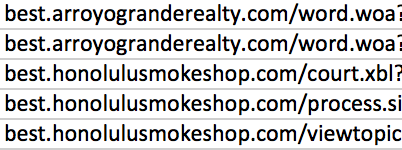
Finally, there was another interesting aspect related to the behavior of domain shadowing and the subdomain structure. There appeared to be two dominant groups related to domain shadowing. The first is the typical domain shadowing using very large random strings similar to what is shown below:
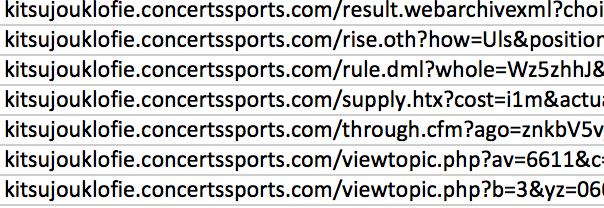
The second group that was found representing a small fraction of the overall domain shadowing activity appears much closer to a normal subdomain. This includes the use of short english based words. This could be designed to try and avoid some types of detection that are looking for large, random string, subdomains.
The basic functionality of Angler is largely identical from one campaign to the next, this new level of variance in domain structure provides a potentially interesting differentiator between campaigns. One note is that all of the behavior was observed during the same time frame.
A Glimpse Inside Angler

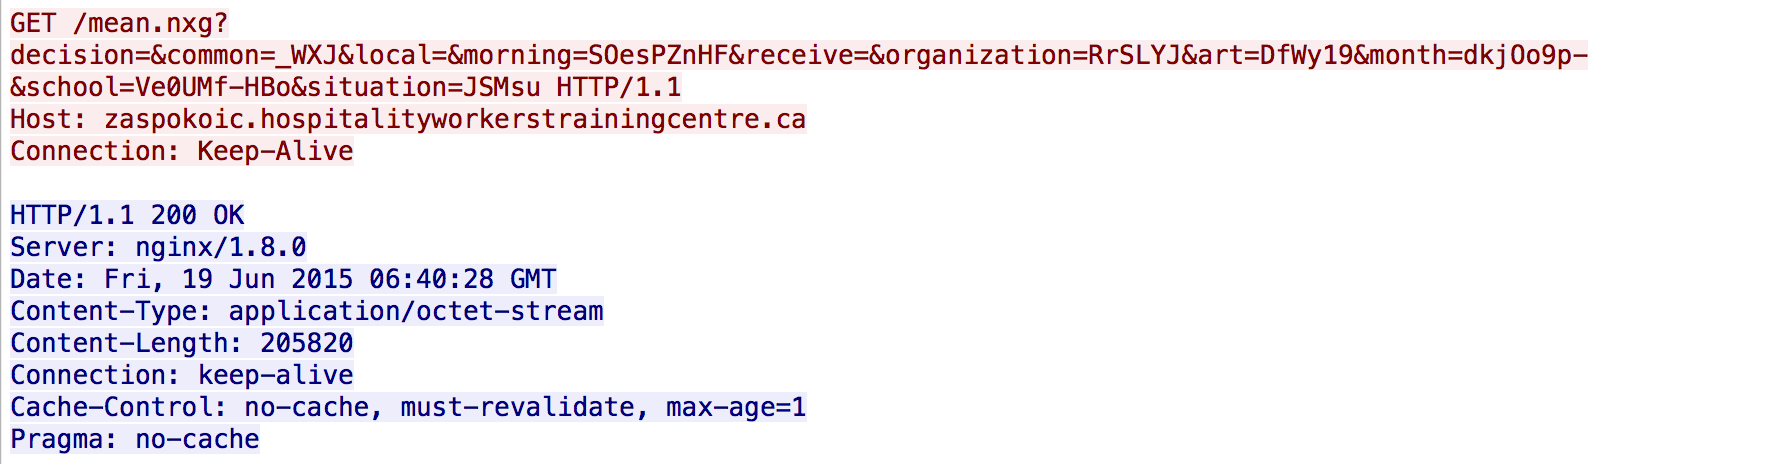
Talos had a unique opportunity to work with Limestone Networks, getting a glimpse inside of how Angler is operating and compromising users. This led to some key findings and identification of previously undisclosed facets of Angler. The first thing of interest found was that the server is running nginx which is common for threat actors to use for nefarious activities. That led to one of the most significant findings, when looking at the nginx configuration file there were a couple of interesting settings. The most significant finding is that the servers that are seen compromising users are simply proxies to hosts that are serving the malicious activity. Talos has observed that when a user makes a connection to one of the servers and is being served data a connection is established on TCP port 81 to a different server, as shown below.
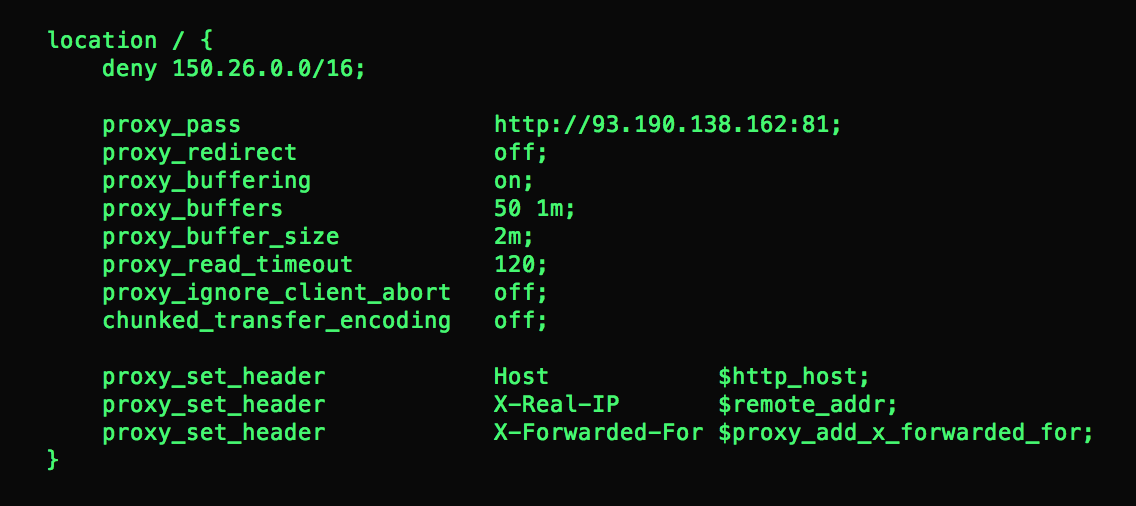
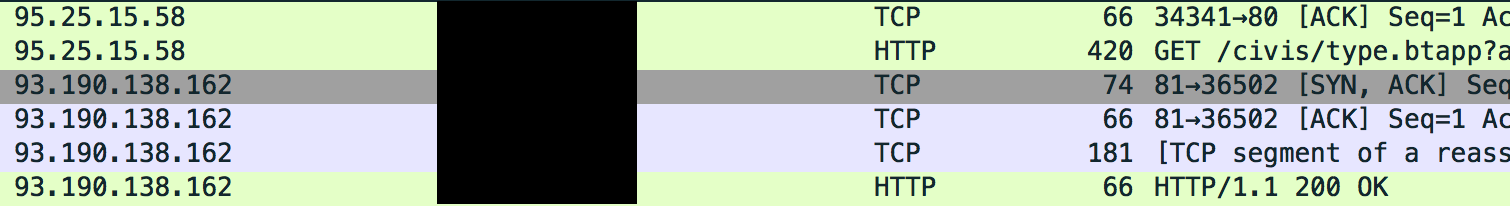
This system, or exploit server, is the host that operates the actual exploit kit. There are many reasons why adversaries would implement this type of behavior. The first is clearly for ease of creation, it is very easy to stand up a basic Linux image running nginx web server that proxies the connection to the true compromise server. This also provides an additional layer of protection, taking down or compromising the proxy server doesn't actually effect the true exploit kit server. It also allows a single exploit kit server to provide data for multiple proxy servers that compromise systems. A network capture Talos obtained confirmed this behavior, as shown below, immediately after a user requests a landing page a connection is established to this proxy server which returned the landing page which was in turn served to the users, a sample of which is shown below.
This behavior was shown repeatedly with large amounts of network traffic between the proxy server and exploit server. Also, of note is the health monitoring that is being done. Also contained in the configuration file of the nginx server were two other sections related to health monitoring and gathering data on users being compromised, as shown below.
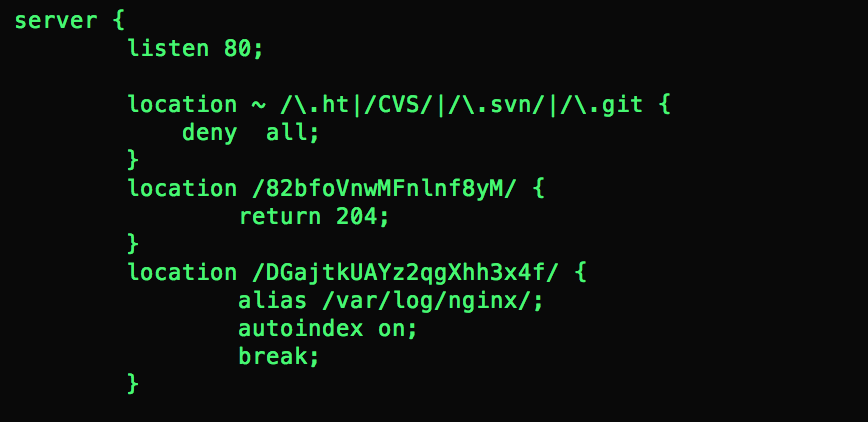
The first section is a specific folder that when queried would return an HTTP 204, which Talos observed being queried from another server that is separate from the exploit server, 95.211.162.166, shown below.

Notice that the actual folder that is being queried is different than what was found in the image, this implies that the specific paths are unique to the server they are deployed, which is the reason for redacting the full path.
The next section allows the adversaries to pull the logs associated with the users that are being served data. This was observed being done by the same IP address that was conducting the health monitoring as shown below.

This access.log is the log file that lists all HTTP transactions that have been conducted on the server and gave a new level of visibility into how pervasive of a problem Angler has become.
Talos was able to work with our collaborators and gain some additional insight into how many servers this health monitoring server was communicating. Over a 30 day period it appears that this single health monitoring server was communicating with 280 different IP addresses. Also identified was a third server, 93.190.143.110, that was receiving a regular data push of ~12MB from the health monitoring server. This server is likely some sort of master server that is getting a roll up of the data that is being gathered by the health monitoring server. A diagram of the overall flow is shown above.
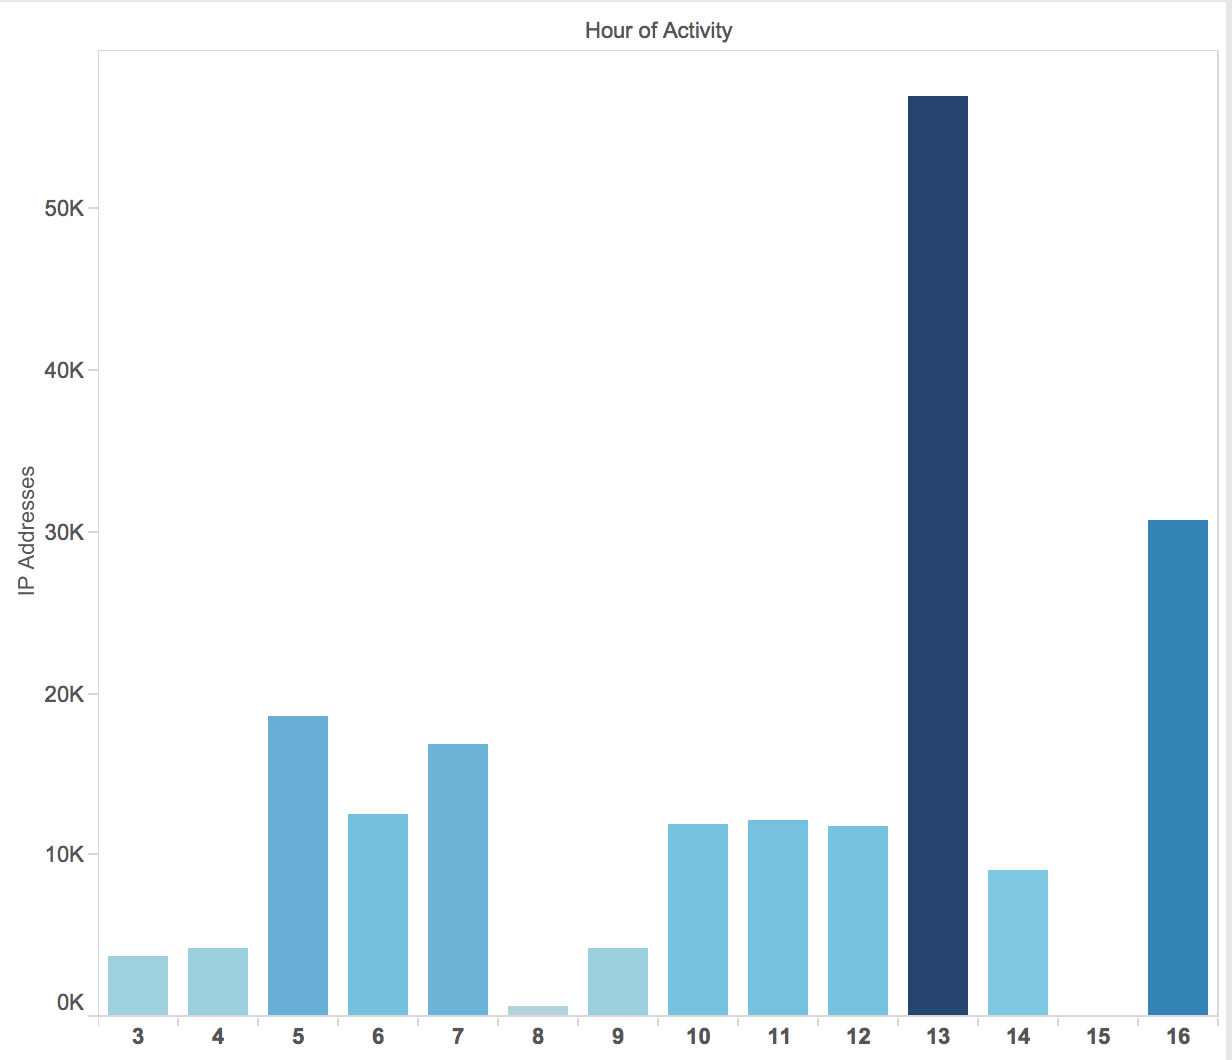
It was the access.log that provided great insight into the amount of systems that Angler is actually compromising. The server Talos observed was active for only a matter of 13 hours. During that time Talos observed more than 90,000 Unique IP addresses being served some sort of Angler Exploit Kit page. At its peak this particular system was serving data to ~60,000 IP addresses in a single hour, a graph showing the amount of unique IP's being served content can be found below.
Given this with the amount of servers Talos has observed serving Angler in a single day gives new visibility to the scope of the users being compromised. One other thing to note is the web browsers that are being targeted. Not surprisingly Angler has focused heavily on Internet Explorer, with the majority of compromises occurring against Internet Explorer 11 running on Windows 7 or Windows 8.1.
Leveraging the data from a single server and correlating the fact that the health server was seen communicating with ~147 servers over a 30 day period, a lot of users are potentially being impacted. Assuming a similar amount of traffic per host that means that more than 13 million IP addresses theoretically could be seeing some sort of Angler traffic in a single month.
Finally, the referers, Talos observed a huge amount of unique referers driving traffic through Angler. These include ads being hosted on very large websites as well as a large amount of adult websites and obituaries. There is no way to know why these particular groups are being targeted and Talos has observed other exploit kits leveraging adult websites to compromise users. The use of obituaries, however, seems largely isolated to Angler. In its 13 hours of activity Talos was able to find more than 11,000 unique referers reinforcing the data that Talos gathered from telemetry indicating the referers are not used extensively, which a huge amount of sites hosting the activity.
One final note regarding remote management and access blocking. It appears that these Linux servers were being managed remotely via SSH using root. The hosts connecting are likely compromised systems from various countries in Europe and Asia. Talos observed five unique IP's logging in via SSH while the server was being set up. Once setup was completed there was little actual login activity. One additional aspect of the server log that wasn't covered was the blocking of specific subnets. There was a group of 75 consecutive class B networks that are explicitly blocked from accessing the server.
Revenue Details
$30,000,000 is a lot of money and requires some explanation on how we arrived at it. First let's look at the Angler instance we analyzed. In the course of a single day of activity, which is the average life of an Angler server, it served exploits to ~9000 unique IP addresses. Based on our previous research we have found that ~40% of users being served exploits are compromised by Angler. This means that 3600 users were compromised by that server. We also found a health server that was monitoring 147 Angler servers over the course of a month. Assuming that the average server compromises 3600 users and there were 147 servers this adversary compromised ~529,000 systems over the course of the month.
Also during our research we found that ~62% of Angler infections delivered Ransomware and the average ransom is $300. Using numbers from USCert via Symantec 2.9% of users pay the ransom. So, using simple math you can easily determine that this specific adversary is making potentially $3 Million a month or a little more than $34 Million annually. It is difficult to be 100% accurate with these numbers so we’ve created the following infographic for you to play with the variables.
Angler Revenue
The average life of an Angler server is one day - in that day we found ~9,000 unique IP addresses with around 3600 compromised users. The average amount per user that pays the ransom is $300, leading to an annual revenue of more than $34 Million.

90,000
targeted victims per day

9,000
observed served exploits in a single day

40%
of users being served exploits were compromised

62%
of Angler infections delivered Ransomware
 Reset Values


Gross Income for Ransomware
IOC
- July IP Addresses (Text File)
- July Hashes (Text File)
- July Subdomains (Text File)
- September IP Addresses (Text File)
- September Subdomains (Text File)
Conclusion
The monetization of the malware economy has continued to evolve over the last several years. Every single year we see small innovations that lead towards the occasional major advance. Today we’re seeing the results of years of major advances being combined with a drive by download vector to form one of the most effective and profitable attacks facing the internet.
Angler Exploit Kit is the most effective exploit kit that Talos has seen. With close to 40% of users hitting Angler infrastructure being compromised it is a significant threat. Between the data Talos was able to gather from the month of July and the additional data gathered from providers Angler is a sophisticated platform for compromise. Users that are browsing using Internet Explorer and are not patching frequently are likely to be affected. Talos observed ample major websites redirecting into the exploit chain. The use of obituaries has also been theorized as a way to target the elderly, which are more likely to be using included web browsers like Internet Explorer, not be patched, and more susceptible to the threat of Ransomware.
Talos will remain vigilant on thwarting this threat in as many different ways as possible, consistently increasing the cost of doing this type of business. As the cost increases the value decreases and hopefully miscreants will think twice before setting up the infrastructure. Talos hopes that this information can be used by hosting companies as well to find Angler activity occurring on their networks, giving them an opportunity to shut them down quickly.
Coverage
In conjunction with this blog post Talos is announcing new signatures designed to detect the backend communication between the proxy and exploit/health servers. Those providers that sit between these nodes are now able to successfully block the transactions, potentially stopping users from actually being served malicious activity. For the most current rule information, please refer to your Defense Center, FireSIGHT Management Center or Snort.org.
Snort SIDs: 28613-28616, 29066, 29411-29414, 30852, 31046, 31130-31332, 31370, 31371, 31694, 31695, 31898-31901, 32390, 32399, 33182-33187, 33271-33274, 33286, 33292, 33663, 34348, 34720, 34969, 34970, 35109, 35110, 35256, 35333-35335, 35550, 36071, 36218, 36315, 36332
| Product | Protection |
|---|---|
| AMP | |
| CWS | |
| ESA | N/A |
| Network Security | |
| WSA |
Advanced Malware Protection (AMP) is ideally suited to prevent the execution of the malware used by these threat actors.
CWS or WSA web scanning prevents access to malicious websites, including the downloading of the malware downloaded during these attacks.
The Network Security protection of IPS and NGFW have uptodate rules to detect malicious network activity by threat actors.